Ever wonder why pods crash infinitely and have to describe, check the events, logs, and figure out the issues? One issue came up during my work when the readiness probes failed. It takes more time to know the causes and later on fix them later on.
All those solutions came up with a cup of coffee called Robusta. Yes, I am talking about Robusta. Robusta is an open-source platform for Kubernetes troubleshooting and automation. As equally as a Docker, an infrastructure-as-code for deploying applications, similarly Robusta is a troubleshooting-as-code for maintaining K8s applications and handling their alerts.
In this blog, I will be share how you can troubleshoot and automate fixing those K8s Application issues using Robusta. Make sure you have set up a K8s cluster(Here I use EKS) and necessary tools(kubectl, helm, python, and pip).
Installation
You need to add a chart repository of robusta and install CLI tools via the python-pip package manager.
helm repo add robusta <https://robusta-charts.storage.googleapis.com> && helm repo update
pip install -U robusta-cli --no-cache
Generate a Robusta configuration so that it can integrate with Slack for when issues occur as well as alerts.
robusta gen-config
Make sure you have created a slack group as we are going to integrate. Allow permission to a channel where you want Robusta to send results.
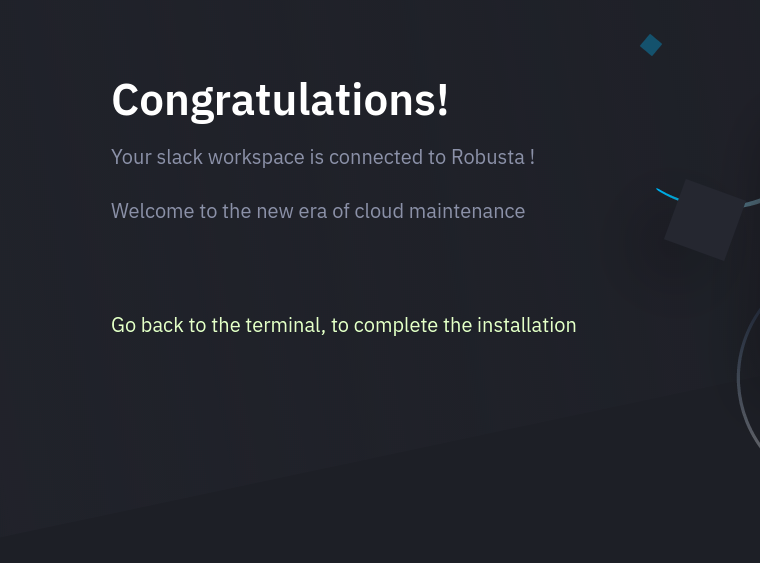
Accept to create a robusta platform account for monitoring the issues on the dashboard in the CLI. The output value will be generated as generated_values.yaml. Don’t share your values with anyone in the public, make it private. Let’s validate and install robusta now.
helm install robusta robusta/robusta -f ./generated_values.yaml -n robusta
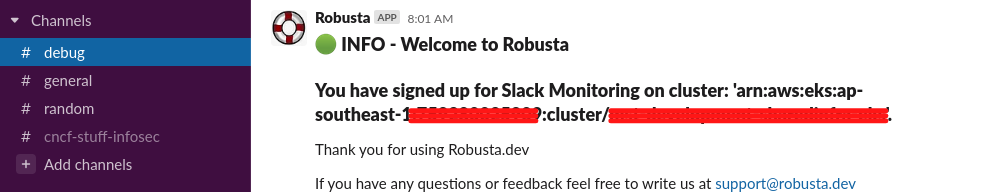
It takes time to install in a k8s cluster. Here I have installed on the namespace called robusta instead of the default namespace. You will get notifications on your slack channel. You can also install Prometheus so that Robusta can suggest fixes for your existing Prometheus alerts and tell you why they happen.
Let’s perform some deployment stuff.
kubectl apply -f https://gist.githubusercontent.com/robusta-lab/283609047306dc1f05cf59806ade30b6/raw
Reference: crash deployment yaml via official robusta one.
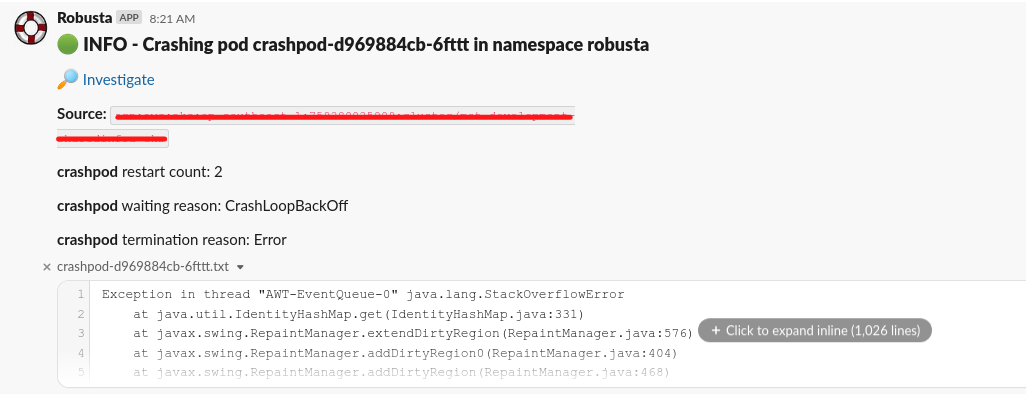
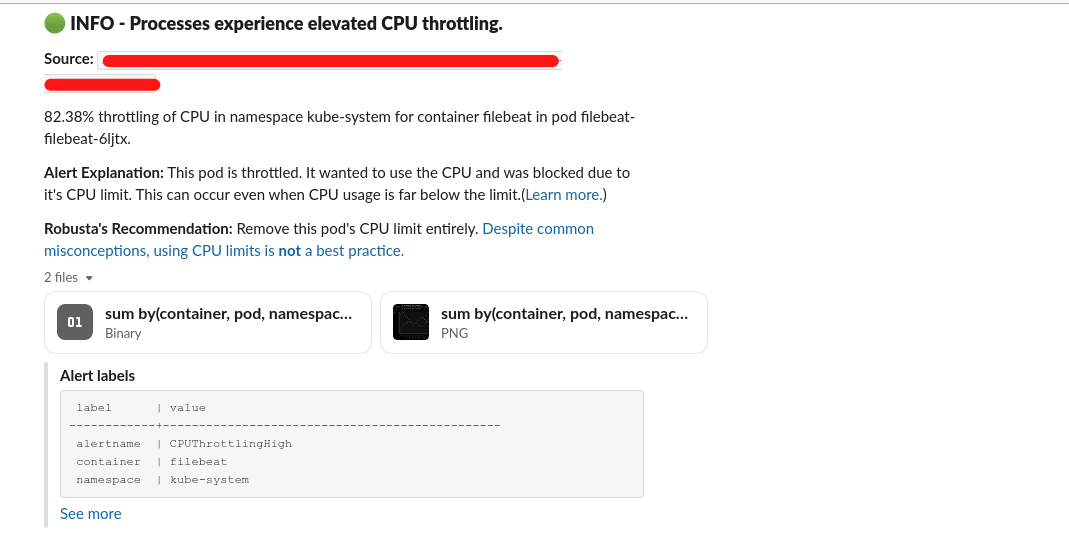
As we have integrated Robusta with our slack channels, any issues on the pod or our nodes of the K8s cluster will be triggered by slack notifications. Recently we created a pod and the result comes up something like this.
You can click and investigate via the Robusta platform. Here is the overview of Robusta dashboard with some issues raised in my EKS cluster.
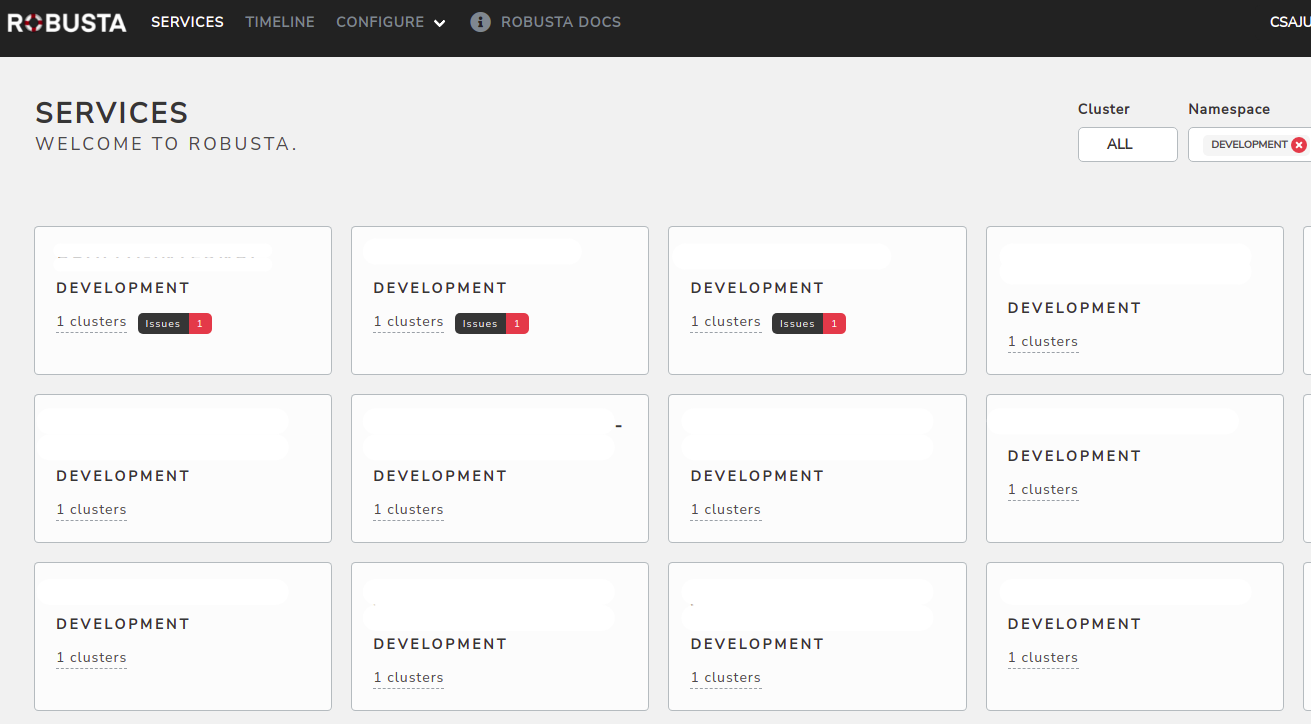
Easy to detect what are the issues going on 😃. Some mitigation and possible solutions will be triggered too. Wanna know more about the enhancement of Prometheus alert via Robusta. You can check their documentation.
Finally, we can easily troubleshoot and automate to fix the issues on our K8s cluster.